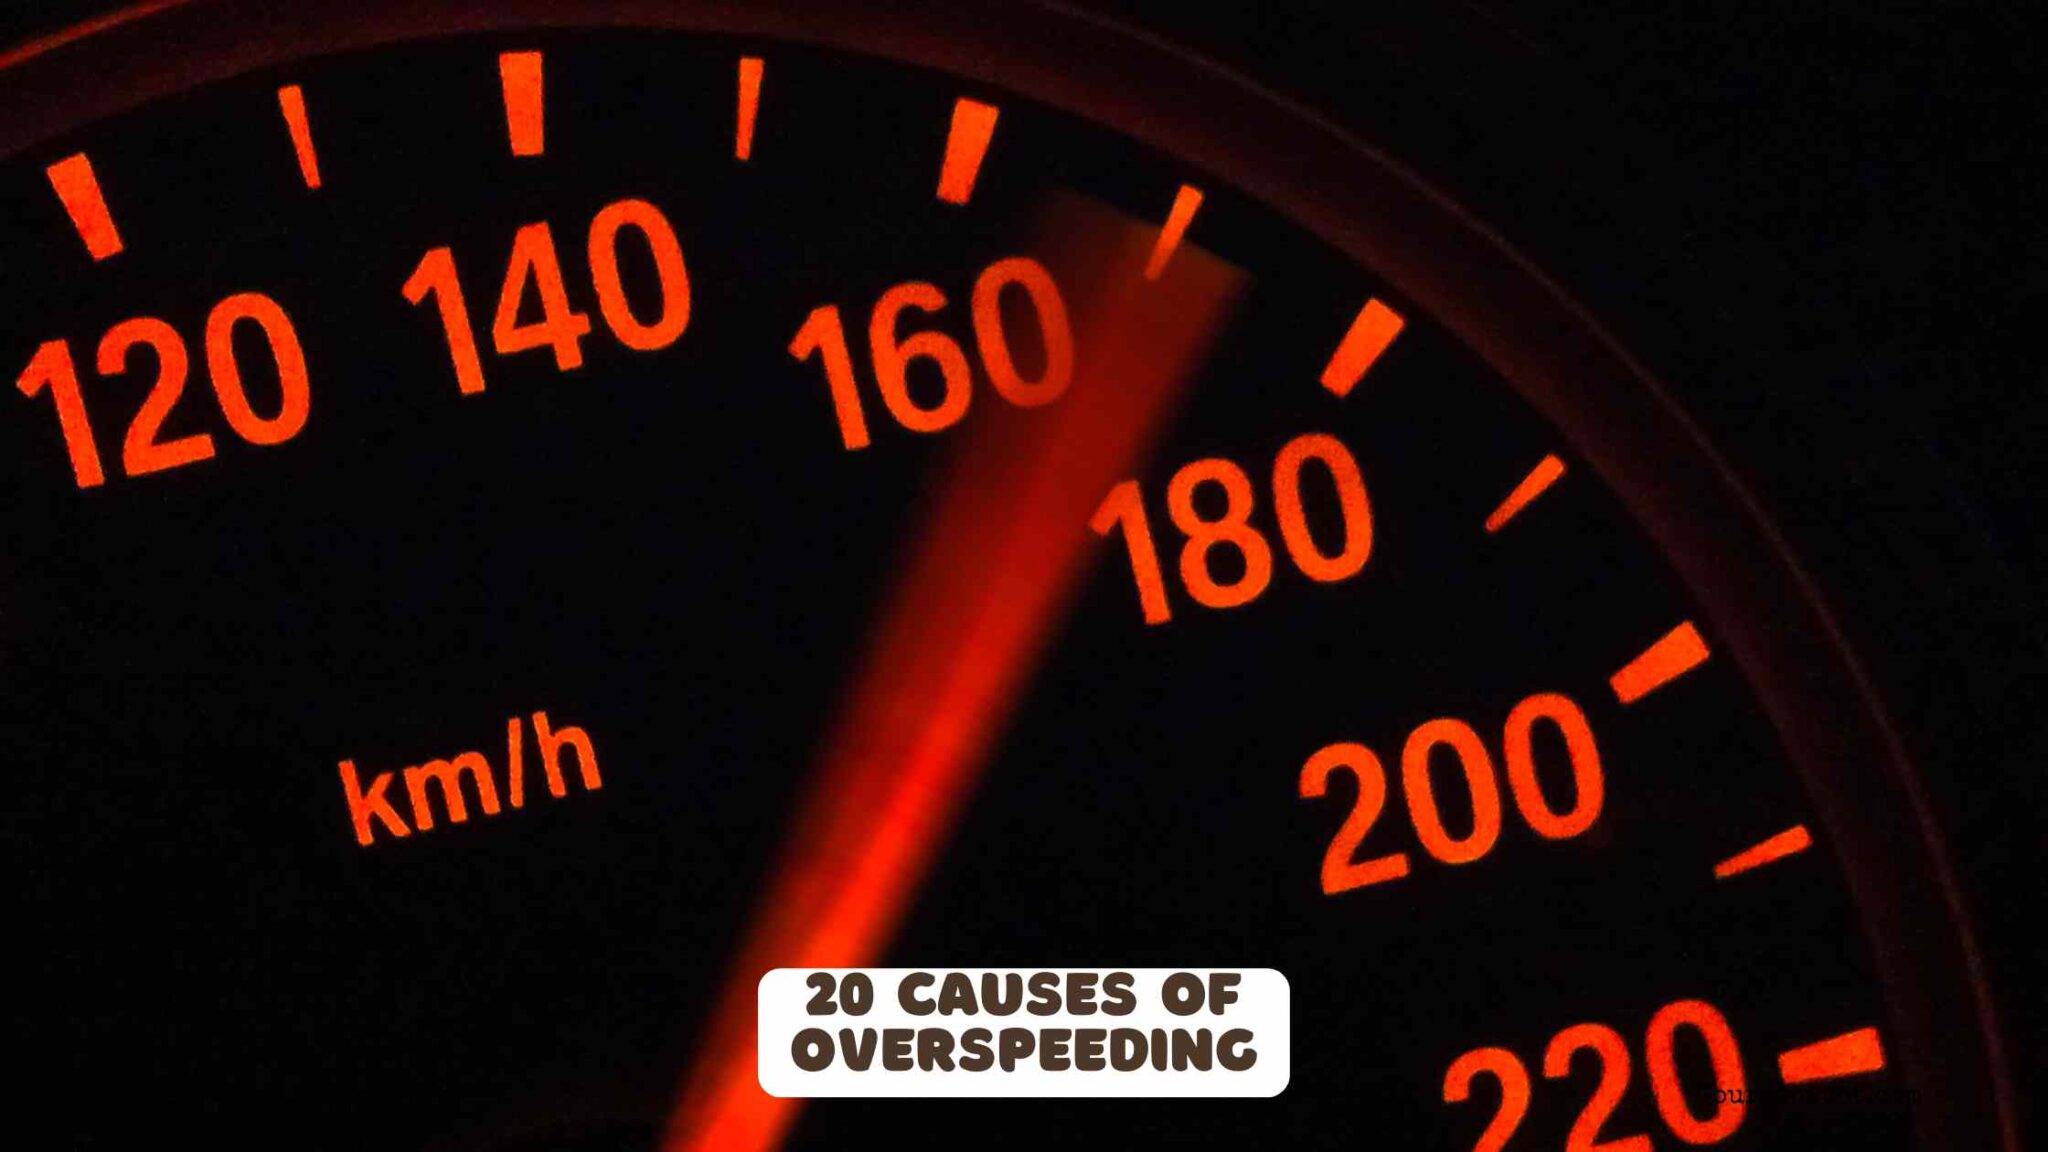
20 Causes of Overspeeding
Speeding is involved in about 29% of all US traffic fatalities. These 20 causes explain why so many drivers routinely exceed speed limits — from thrill-seeking and road rage to sparse enforcement and roads that physically encourage speed.
Why do so many drivers overspeed? Speeding is the most common dangerous driving behavior in the US — surveys consistently show that the majority of licensed drivers admit to exceeding posted speed limits on a regular basis. Yet speeding is involved in nearly 29% of all US traffic fatalities, claiming around 12,000 lives every year. The reasons behind overspeeding range from individual psychology and time pressure to road design, cultural norms, impairment, and inadequate enforcement. Understanding all 20 causes is the starting point for understanding why this problem has proved so resistant to resolution.
Unlike drunk driving — which involves a discrete decision to drive impaired — speeding is woven into ordinary driving behavior for most people. It is done habitually, with low perceived risk, and in conditions where it often goes unpunished. The result is a behavior that is simultaneously extremely dangerous and extremely normalized.
1. Psychological and Attitudinal Causes
1. Thrill-seeking and sensation-seeking behavior. For a subset of drivers — particularly young male drivers — speed provides a genuine physiological reward. Research in sensation-seeking psychology identifies a trait-level tendency to pursue intense, novel, and risky experiences, and this trait correlates strongly with self-reported speeding frequency, street racing involvement, and crash history. High-sensation-seeking individuals experience speed as intrinsically rewarding rather than threatening, and standard deterrence approaches (awareness of consequences) are less effective with this group than with the general population.
2. Overconfidence in driving ability. Multiple surveys across different countries show that 70–80% of drivers consider themselves to be above-average drivers — a statistical impossibility known as illusory superiority. Overconfident drivers underestimate the additional risk that speed adds to their own crash probability, treating speed limits as conservative thresholds for less-skilled drivers rather than as evidence-based safety benchmarks. Overconfidence is particularly pronounced in experienced drivers who have sped many times without incident, reinforcing a false sense of invulnerability.
3. Aggression and road rage. Speeding is frequently an expression of driver aggression — a response to perceived slights from other road users, frustration with traffic flow, or a generalized hostility to constraints on movement. Road rage incidents reliably involve speeding as a component behavior. Aggressive driving personality profiles — associated with lower impulse control and higher stress reactivity — are significantly overrepresented in serious crash statistics relative to their prevalence in the driving population.
2. Time Pressure and Rushing
4. Running late for work, appointments, or events. The most commonly cited self-reported reason for speeding in survey data is simply running late. When drivers perceive they are behind schedule, the subjective cost of maintaining speed-limit compliance rises sharply while the perceived risk of speeding falls — a dual effect that reliably produces speeding behavior. Research using naturalistic driving data confirms that travel at higher-than-normal speeds correlates with morning commute windows when schedule pressure is highest.
5. Chronic time scarcity and the optimization mindset. Beyond acute lateness, a broader cultural orientation toward time efficiency drives routine overspeeding. Many drivers treat speed limits as obstacles to journey-time minimization rather than as safety boundaries. The actual time savings from speeding are modest on most urban trips — exceeding the 30 mph limit on a 5-mile urban route by 10 mph saves approximately 3–4 minutes — but the perception of time savings is larger, and the behavior is reinforced by the experience of arriving slightly faster.
3. Road Design and Environmental Cues
6. Wide, straight roads that feel safe at high speed. Road geometry powerfully influences natural driving speed. Wide lanes, long sight lines, shallow curves, and wide clear zones signal “safety” to drivers at a subconscious level and induce higher speeds regardless of posted limits. A road built to highway geometry but posted at 40 mph will be routinely driven at 50–55 mph by a large share of drivers, because the design does not signal that 40 mph is an appropriate speed. Traffic engineers call this the “design speed” problem — roads built for high-speed traffic but posted at lower limits due to adjacent land use.
7. Light traffic reducing perceived risk. Sparse traffic removes the most immediate environmental feedback that moderates speed — the presence of other vehicles that create visual speed cues and collision risk. Late-night and early-morning driving on otherwise familiar roads produces reliably higher speeds than the same roads at peak traffic volume, partly explaining why time-of-night is such a strong predictor of speed-related crashes.
8. Highway and freeway driving normalizing high speed. Extended high-speed travel recalibrates a driver’s internal speed reference. After 30 minutes of interstate driving at 75–80 mph, transitioning to a 35 mph urban road produces a well-documented perceptual lag — the 35 mph limit feels much slower than it actually is, and drivers unconsciously maintain speeds higher than they would have at the start of the journey. This speed adaptation effect is a recognized factor in crashes at motorway exits and rural-urban transitions.
9. Poor or inconsistent speed limit signage. Where speed limit signs are infrequent, obscured by vegetation, poorly positioned relative to sight lines, or inconsistent with driver expectation, compliance rates fall. Drivers cannot comply with limits they cannot see, and when sign placement creates ambiguity about what the applicable limit is, the uncertainty tends to resolve toward the driver’s preferred speed rather than the lower limit.
4. Behavioral Habits and Social Norms
10. Habitual speeding — treating limits as minimums. For many drivers, speed limit compliance has never been a consistent behavioral standard. When speeding at 10–15 mph above the limit goes unpunished the vast majority of the time, it quickly becomes habitual. Habit-based behavior is resistant to attitude change and awareness campaigns precisely because it operates outside deliberate decision-making — the foot presses the accelerator to the habitual speed before a conscious evaluation of the posted limit has occurred.
11. Traffic flow matching. Drivers in a stream of traffic moving at 15 mph above the posted limit face a genuine social pressure to conform — maintaining the speed limit in fast-moving traffic creates following-distance mismatches and can feel dangerous even when it is legally correct. This “go with the flow” tendency normalizes collective overspeeding and creates self-reinforcing speed cultures on specific road corridors where drivers expect and match elevated speeds.
12. Young driver inexperience and risk miscalibration. Novice drivers lack accurate calibration of the relationship between speed, stopping distance, and crash outcome severity. They have limited experience of near-misses and crashes that would otherwise update their risk perception, and they tend to underestimate stopping distances significantly. The combination of poor risk calibration, high sensation-seeking scores, and peer passenger effects (which research shows increase crash risk at each additional passenger for young drivers) makes the 16–24 demographic the most overrepresented in speeding fatalities relative to licensed driver numbers.
5. Impairment and Reduced Awareness
13. Alcohol and drug impairment. Alcohol directly impairs the cognitive processes responsible for speed regulation — risk perception, reaction time assessment, and self-monitoring of performance. Approximately 40% of alcohol-impaired fatal crashes involve speeding as a co-contributing factor. Marijuana impairment reduces the ability to accurately perceive speed, and stimulant drugs (cocaine, methamphetamine) actively promote risk-taking and suppress the inhibitory responses that would ordinarily moderate speed. The detailed relationship between alcohol and fatal crash rates is examined in the percentage of fatal car accidents caused by alcohol.
14. Driver fatigue and speed perception errors. Fatigued drivers are well documented to underperform on speed monitoring tasks. Drowsiness reduces the visual and cognitive processing bandwidth needed to continually compare actual speed against speed-limit awareness. In monotonous highway driving — the context most associated with fatigue — speed has a documented tendency to drift upward without the driver being consciously aware of it. Micro-sleep events (involuntary 2–30 second lapses) can occur at maintained highway speeds without braking, making fatigue-related speeding crashes particularly severe.
15. Distraction reducing active speed monitoring. Speed regulation is not passive — it requires periodic attention to the speedometer and to visual cues in the road environment. When cognitive attention is captured by a phone, in-vehicle infotainment system, conversation, or navigation task, speed monitoring is one of the first functions to be degraded. Distracted drivers have been shown in naturalistic driving research to travel at higher average speeds than non-distracted drivers on similar road segments, because the perceptual vigilance that normally triggers speed reduction is interrupted.
6. Vehicle-Related Factors
16. High-performance vehicles with powerful engines. High-horsepower vehicles make high speeds easier to achieve and, critically, more comfortable and stable at speed — reducing the physical feedback (vibration, noise, vehicle instability) that would ordinarily signal to drivers that they are travelling fast. A modern sports sedan cruising at 90 mph provides a substantially less alarming subjective experience than a 1980s economy car at the same speed. Vehicle capability has significantly outpaced speed-limit policy, and the gap continues to widen as manufacturers compete on performance metrics.
17. Speedometer blind spots and unfamiliar vehicles. Drivers in rental cars, company vehicles, or newly purchased vehicles are more likely to overspeed because speedometer placement, gauge size, and speed-feel are calibrated differently from their regular vehicle. Analog vs. digital speedometers, head-up displays, and varying physical gauge positions all create conditions where drivers look at speed information less frequently or misread it momentarily.
18. GPS navigation optimizing for journey time. Navigation systems that route drivers via fastest-route calculations create a subtle time-optimization framing that implicitly encourages speed. Estimated arrival times displayed prominently on dashboards create real-time feedback about whether a driver is “on schedule” — a feedback loop that unconsciously rewards higher speeds. Some research suggests that drivers following GPS guidance in familiar areas drive faster than those not using navigation, because the navigation context frames the journey as a time-to-destination optimization problem.
7. Enforcement and Systemic Gaps
19. Low probability of detection and enforcement. The core behavioral economics of speeding enforcement: in the US, a driver exceeding the speed limit on a given trip faces a very low probability of being stopped and ticketed — estimates suggest that for every speeding citation issued, hundreds of speeding violations go undetected and unpunished. When the expected cost of a behavior is low (low probability × moderate sanction), deterrence theory predicts high violation rates. This is precisely what is observed. Countries and regions that implement automated enforcement (speed cameras) significantly increase the perceived probability of detection and consistently produce reductions in violation rates and crash rates.
20. Weak and inconsistent legal penalties. US speeding penalties — fines, license points, and insurance premium increases — are widely considered insufficient to deter routine speeding for most income brackets. A $150 fine does not meaningfully change the cost-benefit calculation of someone who regularly speeds. The inconsistency of enforcement adds to the problem: identical speeding violations in identical contexts are penalized at very different rates depending on jurisdiction, time of day, officer discretion, and whether the driver has prior violations. This inconsistency undermines both specific and general deterrence. Compared to the multi-day license suspensions and mandatory retraining used for moderate speeding violations in some European jurisdictions, US penalties are structurally weak deterrents.
Addressing overspeeding requires engaging with all of these causes simultaneously. Awareness campaigns and fines have modest impact precisely because speeding is not primarily an information problem — most drivers who speed know the limits and know that speed is dangerous. The effective interventions — automated enforcement, road design changes, lower urban limits, and vehicle-level technology — work by changing the environment in ways that make compliance easier and violation harder. For a full picture of how fatal the consequences can be, the percentage of fatal car accidents caused by overspeeding covers the statistical toll in detail.